Health Statistics
Number of Registered Persons with Disabilities and Disability Pension Recipients
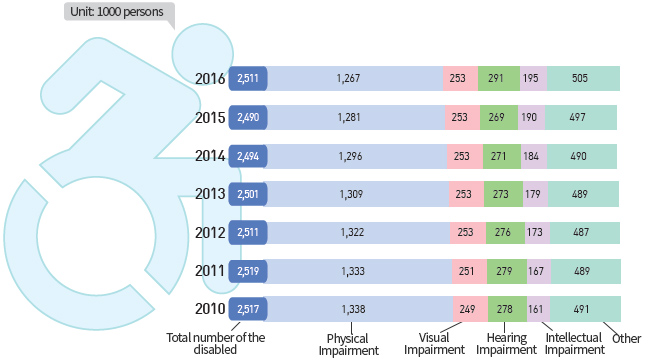
- As of 2016, 2.511 million people were registered as disabled. Physical disability accounted for the largest share at 50.5%, followed by speech/hearing disability (11.6%) and visual disability (10.1%).
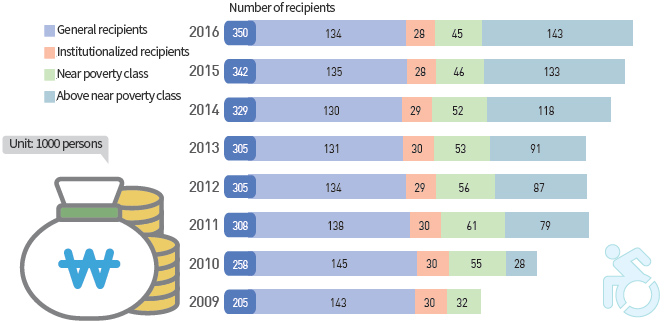
- The number of Disability Pension recipients reached 350,000 in 2016, which represents was a 2.3% increase from 2015 and a 35.7% increase from 2010.
- Previously, disability allowances were limited to BLSP* benefit recipients and individuals at or below 50% of the median income. The coverage has been expanded to include those above the 50% threshold under the Disability Pension (*BLSP: Basic Livelihood Security Program).
Number and Status of the Disabled Registered(2010-2016)

| category | 2016 | 2015 | 2014 | 2013 | 2012 | 2011 | 2010 |
|---|---|---|---|---|---|---|---|
| Total number of the disabled | 2,511 | 2,490 | 2,494 | 2,501 | 2,511 | 2,519 | 2,517 |
| Physical Impaiment | 1,267 | 1,281 | 1,296 | 1,309 | 1,322 | 1,333 | 1,338 |
| Visual Impaiment | 253 | 253 | 253 | 253 | 253 | 251 | 249 |
| Hearing Impaiment | 291 | 269 | 271 | 273 | 276 | 279 | 278 |
| Intellectual Impaiment | 195 | 190 | 184 | 179 | 173 | 167 | 161 |
| Other | 505 | 497 | 490 | 489 | 487 | 489 | 491 |
Number of Disability Pension Recipients(2009-2016)

Number of recipients
Unit : 1000 persons
| category | 2016 | 2015 | 2014 | 2013 | 2012 | 2011 | 2010 | 2009 |
|---|---|---|---|---|---|---|---|---|
| Total | 350 | 342 | 329 | 305 | 305 | 308 | 258 | 205 |
| General recipients | 134 | 135 | 130 | 131 | 134 | 138 | 145 | 143 |
| Institutionalized recipients | 28 | 28 | 29 | 30 | 29 | 30 | 30 | 30 |
| Near poverty class | 45 | 46 | 52 | 53 | 56 | 61 | 55 | 32 |
| Above near poverty class | 143 | 133 | 118 | 91 | 87 | 79 | 28 |